Wind Speed
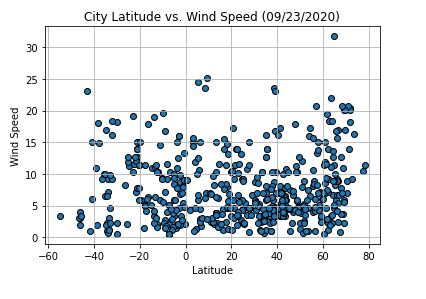
Like the other scatter plots, we used pyplot to create this chart. In this scatter plot, we analyzed the cities' wind speed (y axis) based on their latitude (x axis). We did not see a relationship between the two.
Visualizations
Wind Speed
Like the other scatter plots, we used pyplot to create this chart. In this scatter plot, we analyzed the cities' wind speed (y axis) based on their latitude (x axis). We did not see a relationship between the two.
Visualizations