Max Temperature
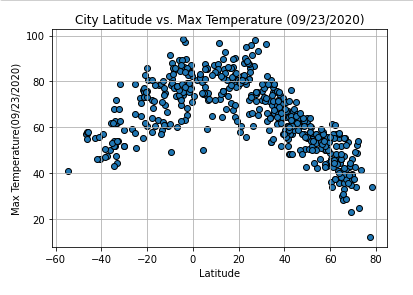
In the above chart, we analyzed the cities' maximum temperature (y axis) based on their latitude (x axis) using a scatter plot. As we can see, the closer the latitude is to zero (0) the higher the temperature.
Visualizations
Max Temperature
In the above chart, we analyzed the cities' maximum temperature (y axis) based on their latitude (x axis) using a scatter plot. As we can see, the closer the latitude is to zero (0) the higher the temperature.
Visualizations